The Good and the Bad Merger/Acquisition (Topic 9)


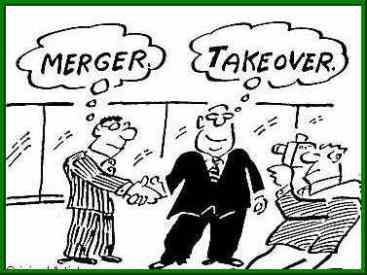
            Many mergers fall flat on their faces and many become legendary. Mergers and acquisitions can cause bankruptcy, the firing of executives and even a breakup. On the other hand they have the potential to generate growth, increased market power, cross-border advantages, synergy etc. We tend to think of a merger and an acquisition/takeover as the same was when in fact they are somewhat dissimilar. A merger is the combining of assets and operations, usually between two similar sized companies, in an agreement to join together. In contrast, a takeover is the procurement of one company by another through the purchases of share capital. Most mergers/takeovers have a certain degree of risk attached to it but through accurate planning, knowledge and intuition they can be extremely successful. For the purposes of investigating what causes a successful and a not so successful merger/takeover I am going to analyze and contrast two high profile takeovers, Disney-Pixar and Quaker-Snapple.

Image

            Walt Disney took over Pixar for a whopping $7.8 Billion in 2006. “Most acquisitions, particularly in media, are value-destroying as opposed to value-creating, and that certainly has not turned out to be the case here,”, a quote from David A. Prices 2008 book ‘The Pixar Touch: The Making of a Company’ This quotation encapsulates what happened with this acquisition. It wasn’t until the run up to the end of the production contract between the two companies when Disney decided they didn’t want to lose connection with Pixar and it was obvious that a merger made perfect sense. Since the acquisition Disney-Pixar has pumped out movies such as ‘WALL-E’, ‘Up’ and ‘Bolt’ with plans for Pixar to release movies twice-yearly, unimaginable before the takeover.

            One of the key reasons for the success enjoyed by Disney-Pixar is due to how related the business where before the takeover which leads to more synergies when merged. The joining boosted Pixar’s creativity leading to higher quality cinematic output than before. Disney opened the door to a huge distribution network for Pixar’s releases. Gordon Phillips, Bank of America professor at the University of Maryland and a research associate at the National Bureau of Economic Research (NBER), views that:


“The Disney-Pixar merger is consistent with Disney choosing Pixar because it is similar enough to permit new product synergies,”,

“Following the merger, many Disney computer-animated movies (e.g., Toy Story, A Bug’s Life, Cars) have been produced using Pixar technology and distributed by the merged company.”,

Gordon Phillips

Image

I believe this friendly takeover allowed both companies to avoid future competition and increased market power. Two of the major players in the creation and production of animated movies industry joining forces would seem like a key play to any competitor or onlooker. The premium that Disney paid for the Pixar acquisition was without a doubt evaluated in light of the nature of the animation content that Pixar harvests and the distribution opportunities it offers through innovative technologies. As animated, family-focused content, Pixar movies are also known to maintain comedy, action and music features, sections of which can be repurposed into short-form programming which, like music, is easily downloadable and attractive for a number of consumer portable devices, including Apple’s iPods and iPhones. If the accomplishment of the iPod with music is an indication what it will be like for video, Disney’s acquisition of Pixar bids wonderful commercial opportunities for Disney in future media and entertainment markets.

In contrast to Disney’s takeover of Pixar, the Quaker-Snapple acquisition was not so effective. Bought for $1.7 billion in 1994, Snapple cost Quaker a mere $1.6 a day since it was acquired up until its sale 27 months later. With a loss of $1.4 Billion on the asset, CEO William Smithsburg’s credibility was forever tainted, and countless executives were dismissed- This is the darker side of a takeover.

Image

Despite criticisms from experts, Quaker launched a new marketing campaign for the product and aimed to place Snapple in every retail and restaurant outlet physically possible. Their efforts were in vain, causing disinterest in the product thanks to a wrongly directed marketing plan and the introduction of similar products by strong competitors into the market. The over valuation, to the extent of $1billion, seems justified now.

From the outset, Quaker’s view of Snapple was risky and, viewed from another perspective, its disappointment the consequence of nothing less than a “fatal mismatch between brand challenge and managerial temperament.” Why and how did Snapple attained its success? This should have been looked at in extensive detail in the lead up to acquirement. Summarising, prior to making any decisions regarding acquisition or management, Quaker should have widened its view on potential gains past sheer considerations of operational value. Had this been done, Quaker would have been recommended against purchase, with the view that the product that Snapple offers would fit better under another company’s control, not Quaker’s for obvious brand and cultural dissimilarities. Even Quaker’s marketing strategy for their new product exposed some very clear and significant differences between Quaker and Snapple. Quaker’s warlike image targeted to customers wasn’t the appropriate frame of location for the happy-go-lucky, whimsical Snapple? If Quaker hoped to have successes with Snapple, it should have seen through the eyes of its actual target market. Had Quaker understood this, it would have more shrewdly valued the acquisition decision and better judged whether to undergo the takeover or not

Image

Quaker’s acquisition failed due to its inability to identify it was playing the wrong game. As a consequence, it treated two extremely unrelated brands in a similar manner and lost a significant amount of money and shareholder value which at the end of the day cost the company dearly in doing so. A more informed perspective and less risk aversion would have protected Quaker from financial tragedy.

“Of course it is never possible to predict with certainty that an M&A will be successful and many mergers do fail,”

 “Failure may be the result of intangible or human factors we cannot measure. Mergers can be viewed like R&D (Research and Development) which often times is not successful. However the gains from success can be substantial and firms may also lose if they do nothing and do not attempt to introduce new products both through M&A and also through R&D.”

Gordon Phillips
Image

References

Phillips, G. Want a successful merger? Be similar yet different enough, Available Online At: http://knowledge.insead.edu/INSEAD-knowledge-want-a-successful-merger-111116.cfm

DiMaggio, M. (2009). The Top 10 Best (and Worst) Corporate Mergers of All Time… Or, the Good, the Bad, and the Ugly, Blog Available Online At: http://www.rasmussen.edu/degrees/business/blog/best-and-worst-corporate-mergers/

Porter, M. (1996). Discussion of sustainable competitive advantage, What Is Strategy, pp. 61-78.

“How Snapple Got Its Juice Back,” HBR 02016 (January 2002), p.7. Ibid., p. 6.

Fonda, D. (2006). Who Gains from a Pixar-Disney Merger?, Time Business, Available Online At: clovercap.com/documentView.asp?docID=32


How and Why Companies Should Manage Currency Risk (Topic 8)


             The currency risk a company faces is the consequence an unexpected exchange rate change would have on the value of the company. An unanticipated exchange rate change can result in a potential gain or loss for the firm. A change can affect the shareholder value but the extent to which a change has an affect is difficult to assess. Academic evidence thinking currency changed to stock price variation is weak. In this post I’m going to discuss what currency risk a firm faces and methods it can use to manage this risk. It is very important that the correct risk management framework is matched to the problem.

                Firstly why should firms manage currency risk? Some firms don’t, even though they acknowledge the affect a change can have on their earnings. They abstain from active foreign exchange risk management for many reasons. Firstly some managers don’t fully understand the concept and find it difficult to speculate on the effect it will have, thus labeling currency risk management ‘outside the business’s field of expertise’. Some firms ignore the fact that the majority of a firms value is generated form future transactions that have not yet occurred, thus overlooking hedging the risk. Some argue that they do all they’re business in Yen, for example, but if you sell you product/service abroad then you will be undercut but local rivals. So should firms attempt to manage currency risk? The Modigliani-Miller Theorem highlights how shareholder value cannot be improved with financial manipulations. Do managers serve the best interests of shareholders by second guessing what risks to hedge? In my opinion they do. Currency risk and may other risks like it should definitely be managed to tailor shareholder’s needs. The analyzing of exposure of currency fluctuations requires speculation of levels of susceptibility of cash flow to unexpected currency rate variations. Managers, having a more detailed knowledge of the company; market; and competitors, can do this more precisely than shareholders in my opinion.

Image 

                Identifying your exposure to exchange rate variation is the starting point to managing the risk. Managers must identify the level of value at risk. An enterprise’s value can be open to currency risk through accounting data, in the form of translation exposure and through ongoing cash flow effects, economic exposure. Accounting exposure is born from the need to report accounts in a specific currency, home currency of the HQ of the corporation, when much of the business transactions take place abroad in different currencies. Deciding on the appropriate treatment of this issue can result in gains or losses in the company’s accounts. Economic exchange rate exposure can be outlined in this example –

                ‘A Venezuelan oil company has an oil refinery in the Netherlands for delivery to Germany. The company invoices clients in Euro. Long term source of finance is under determination. Salaries must be financed in Dutch Guilders. Should the shorter term debt be hedged and what currency should the longer term debt be received in?’

How the firm’s exposure is defined has a significant effect on the risk management decisions. The translation exposure is related to the location of the assets. The transaction exposure is concerned with the currency of denomination of the assets. The Economic exposure is related to the currency of determination. The world market for oil is in USD, which is the effective currency that the company’s future sales will be made. If the USD strengthens against the Euro, the oil company should increase prices.

Image

       Before managing exchange exposure, a company must ask itself how quickly can they adjust pricing to offset a change in a currency exchange rate, how diversified are their factor and                       product market and to what extent would a change in the exchange rate have on the value of their assets. I have demonstrated that the exchange rate has the potential to have a huge effect on operation cash flows. How can this risk be managed? The perfect scenario would be to have a supertanker with your whole corporation on board which docks wherever has the most favorable exchange rates for your business. Perhaps a jumbo jet would be more suitable considering the pace of the financial world today. In reality neither would be possible. This is why there is a need for businesses to employ specific financial tools and techniques in order to manage foreign exchange risk. These tools include forwards, futures, debt, swaps and options. The all effectively serve the same purpose but in slightly different ways.

Image

                Let’s firstly talk about forwards. A currency forward contract is a transaction privately agreed upon but with the actual exchange of one currency for another made at some specific time in the future. No exchange of many occurs until the settlement date has been reached. There is a commitment between the two parties in this agreement. There is usually no third party or middle man in a forward contract so there is a real default risk to take into account. A futures contract is very similar to a futures but is standardized. The amounts, delivery dates etc. are standardized and are traded in an exchange such as the LIFFE in London or the SIMEX in Singapore. The default risk in a forward is minimized in a future because there is a daily cash compensation feature through a middleman.

                Currency options give more flexibility than forward contracts. The give you a right, not an obligation to exchange currency at a later date. The right to buy is a call option; the right to sell is a put option. To obtain this right a premium must be paid. For example:

                ‘Company A has agreed to purchase €15 million worth of good A with payment in 200 days. The dollar has recently weakened dramatically against the Euro and company A is fearful of any further cost increases of import

s. He believes the Dollar volatility will continue. Dollar/Euro spot – $2.25; forward – $2.19. The company is uncertain of the direction of the swing of the dollar and is therefore contemplating purcha

sing a call option at a strike price of $2.21. The best value premium the company could find was 0.85%. The option was chosen, limiting the downside while not restricting the potential savings.’


                In the example company A hedged against the instability risk of the Dollar. The higher the volatility the higher the price of the option would be. His use of an option was justified. If the exchange rate risk was left unmanaged the earnings and market value of the company have the potential to fluctuate/deteriorate. Significantly large exchange rate movements can cause major problems for particular companies, depending on how and where the conduct business.

                 The measurement and management of foreign exchange risk and should devote resources to manage this risk is a very complex topic. If you believe you company can benefit from the active management of currency risk it is in your interest to identify your exposure and to take time in analyzing the most suitable method to minimize this risk. Doing this will allow you to mitigate potential loss of earnings and shareholder value through variations in currency rates, a desire of all business.why firms s


References

Image
 

Alder, Michael. “Translation Methods and Operational Foreign Exchange Risk Management,” Chapter 6 of Göran Bergendahl, (ed.) International Financial Management, Stockholm: Norstedts, 1982.

Cornell, Bradford. “Inflation, Relative Price Changes, and Exchange Risk,” Financial Management, Autumn 1980, pp. 30-44.

 Dufey, Gunter. “Corporate Finance and Exchange Rate Variations,” Financial Management, Summer 1972, pp. 51-57.

 Eaker, Mark R. “The Numeraire Problem and Foreign Exchange Risk,” Journal of Finance, May 1981, pp. 419-427.

 Hekman, Christine R. “Foreign Exchange Exposure: Accounting Measures and Economic Reality,” Journal of Cash Management, February/March 1983, pp. 34-45.

 Hodder, James E. “Hedging International Exposure: Capital Structure Under Flexible Exchange Rates and Expropriation Risk,” unpublished working paper, Stanford University, November 1982.

Jacque, Laurent L. “Management of Foreign Exchange Risk: A Review Article,” Journal of International Business Studies, Spring/Summer 1981, pp. 81-101.

 Makin, John H. “Portfolio Theory and the Problem of Foreign Exchange Risks,” Journal of Finance, May 1978, pp. 517-534.


How Can We Minimize Systematic Risk?


Every investment portfolio has a specific level of risk. This risk is made up of both systematic and non-systematic or diversifiable risk. Many investors mistake these two types of risk and believe that they are reducing their systematic risk when diversifying their portfolio. This is not the case.

Non-systematic risk refers to that risk related to individual companies or industries. This company/industry specific risk can be curtailed through diversification (1). Diversification can be achieved by taking up comparatively smaller positions in a number of fairly similar companies in a similar market in contrast to taking large stakes in one or two businesses(2). One can adequately diversify their portfolio by just investing in a relatively small number of different firms. For example, when comparing portfolio A with one stock and portfolio B with 3 or 4 stocks we can see that the non-systematic rick of portfolio A in contrast to portfolio be in usual circumstances will be substantially higher. We can see in the graph below that as number of holdings increases the amount that non-systematic rick decrease diminishes rapidly.

(3)

            It is clear that once non-systematic risk is reduced to its optimal level through diversification there still remains a somewhat significant level of portfolio risk, systematic risk. The levels of this risk depends on the economic climate you live in, the volatility of interest rates, the political and economic stability of the country you live in, etc. How this risk can be minimized is what I will be discussing in this post.

Systematic risk is the risk attributed the entire market or market segment (4) Systematic risk can affect our portfolio through interest rate hikes, a subprime crisis, a bubble popping or even a country defaulting (5) any one of these could cause massive panic selling and potentially could have a massive effect on the performance our portfolio. I am now going to outline two methods to reduce systematic risk, Asset Allocation and Hedging.

Mitigating Systematic risk through asset allocation is achieved through distributing ones investments across assets from dissimilar markets and segments. The lower the correlation between each asset, the more unlike the various assets will be. This is a very important factor in portfolio theory. (6)

(6)

                From the graph above, if one has invested solely in A this risk and return is at point A. Intuitively if one invests 50% in A and 50% in B their risk/ return ration would be somewhere around point C. Modern portfolio theory states otherwise. In fact if an individual decides to invest partly in both A and B, they’re risk/return levels will be somewhere along the blue line (the efficiency frontier). Note that investing heavily in A (less risky) and a smaller amount (10%-20%) in B (more risky) lead to a risk/return at E.  At E we have a substantially higher return with only a small amount of added risk (illustrated by the dotted lines above). As more of the risky asset is consumed the Level at which return with respect to risk increases diminishes. The Convexity of the efficiency frontier is also known as the ‘free lunch’ of investing. Using asset allocation potentially increases returns and reduces volatility in a portfolio. The degree at which you benefit from asset allocation is dependent on the number if holdings, risk/return levels in each asset, the level of correlation between the assets (6). This is illustrated in the shape of the efficiency frontier. Asset allocations can be indispensible method of reducing Systematic risk.

When investing in futures, equities, bonds etc., investors always carry the risk of a change in interest rates or exchange rates which could in turn reduce the value of their portfolio. Mitigating the risk of this happening can be attained through hedging. When investing in the US Market one must always to alert to changes in the USD. The USD does not only represent the currency of the United States but it is also an indication of the performance of the US economy as a whole. Removing your risk of variations in the value of the USD also reduces your risk to sudden declines in the US economy, therefore reducing your systematic risk (7). Let’s say that you wanted to buy wheat futures. This means that you are bullish on wheat. You expect the value/price of wheat to increase in future. If you are long wheat then you are also indirectly short USD. If there is a crisis in Europe and the euro becomes undervalued when compared to USD, you will be in a less favourable position despite nothing fundamentally changing in the wheat market. The only thing that has changed is the value of the USD. The risk associated with something like this happening is included in the systematic risk of your portfolio. To combat this we must also take up a bearish position in some other asset. Let’s choose Corn as an example. You’re speculation that corn will decrease in value so you short corn and as I’ve explained above you are long USD. No you’re in a position where you are long wheat (and short USD) and short corn (and long USD). If we invest equal amounts in each commodity we will essentially be long wheat / short corn and the USD risk will be hedged out (7). A loss in one investment due to variations in the currency will be offset by the other investment.

This Method of Hedging out risk can be particularly useful if firstly you are fearful in the volatility of the currency you wish to invest in. This makes it desirable to hedge out the currency’s influence one the return of the portfolio. Secondly, if you happen to already want to buy one asset and short another for a particular reason. For example if you know one asset performs particularly well in a certain period while at the same time a different asset performs particularly bad (Cotton vs Sugar)

Combining the methods discussed above an investor can minimize both systematic and non-systematic risk in their investment portfolios while keeping return as close to the desired level as possible.

 References

(1) A., Johnson, 12/07/10, Reducing Non-Systematic Risk, The Reasoned investor, Available Online At: http://thereasonedinvestor.wordpress.com/2010/07/12/reducing-non-systematic-risk/

(2) A., Johnson, 12/07/10, Reducing Non-Systematic Risk, The Reasoned investor, Available Online At: http://thereasonedinvestor.wordpress.com/2010/07/12/reducing-non-systematic-risk/

(3) Banerjee, P. (2008) Systematic versus Non- Systematic Risk, Executive Fianacial Planning, Available Online At: http://www.executivefinancialplanning.com/2008/03/systematic-risk-versus-non-systematic-risk/

(4) A., Johnson, 12/07/10, Using asset Allocation to Reduce Systematic Risk, The Reasoned investor, Available Online At:  http://thereasonedinvestor.wordpress.com/2010/08/15/using-asset-allocation-to-reduce-systematic-risk/

(5)   C., Turner, 10/03/10, FutureSource’s Fast Break Newsletter,  http://www.danielstrading.com/blog/2011/02/16/hedging-systematic-risk/#.Ts4cXISrl8H

(6)   A., Johnson, 12/07/10, Using asset Allocation to Reduce Systematic Risk, The Reasoned investor, Available Online At:  http://thereasonedinvestor.wordpress.com/2010/08/15/using-asset-allocation-to-reduce-systematic-risk/

(7)   C., Turner, 10/03/10, FutureSource’s Fast Break Newsletter, http://www.danielstrading.com/blog/2011/02/16/hedging-systematic-risk/#.Ts6AKYSrl8H

How Do Firms Finance Themselves in Theory and in Practice? How is Risk a Major Player in this Decision and in the Decision of Investors? (Topic 5)

How firms should in theory finance themselves and how they actually do can be very different in many cases. This all depends on the type of firm; its stage in its life cycle; the level of growth the firm is experiencing; the current leverage of the company; geographical location; credit rating; tax rate; bankruptcy risk; economic climate; trade of between cost of debt and cost of equity, owner etc.  There is no generic capital structure model that you can copy and paste on to every business. Many similar businesses in the same market have vastly different capital structures. A firm’s desired capital structure varies with economic climate. As EBIT diverges between boom and recession, the different levels of debts will give a higher EPS and earnings per share. Equity is favourable during a recession and a mixture of debts and equity in a boom. A firm will rarely set a debt-equity target at foundation. The level of debt and equity forms and changes overtime until the capital structure of that particular business is designed.

Franco Modigliani and Merton Millar devised a theorem of capital structure which defines the cornerstones for modern corporate finance theory. M&M proposition 1 states that the market value of a firm is independent of its capital structure. This only holds in an efficient without the existence of taxes, asymmetric information and bankruptcy costs. The market value of a firm is given by the capitalisation of its expected EBIT at a rate r.

Image

            In essence this 1st proposition boosts unlimited financial leverage which, although has boosted financial and economic activity in recent times, increases risk, uncertainty and complexity in those activities. Investment banks prior to the 2008 crisis are prime examples of excessively leveraged firms (1). Lucey and mac an Bhaird also investigated how information asymmetries highlight the need for collateral in securing Debt finance. This collateral is contributed usually by an owner in the form of personal assets or equity (2).

The M&M second proposition goes on to explain that the (expected return) of a firm is dependent on the cost of debt, debt/equity ratio of the firm and the required rate of return on debt and equity.

Image

This formula rearranged is the working average cost of capital formula (WACC). If proposition 2 holds, WACC will be independent of the capital structure. This fact is illustrated by the straight line (WACC) below. The WACC has no slope and therefore has no relationship with the debt-equity ratio and remains the same as leverage increases (3).

Image

            The graph above highlights the 2nd proposition. The Required rate of return is linear with slope (r-). As the business borrows more debt, the required return on equity increases. This is due to the higher chance of bankruptcy.

When an outside investor is accessing if a particular business is a good investment, capital structure is a core factor taking into consideration. There are two types of investors, a debt and an equity investor. Some investors seek to gain a share in the business and some seek to provide debt to the business. The risk appetites of these two forms of investors differ, as do they’re expected return. Debt holders only have a claim on a given level of interest in the form of set instalments and do not have any stake in the performance of the business. Equity holders on the other hand benefit from the performance of the business in the form of capital gains and dividends but don’t have any guaranteed level of return. Equity holder’s losses are limited to the level of capital they brought to the company but their upside is infinitely large. This endless upside is the reason for the higher risk involved with equity. In contrast, debt holders risk is that the company will be unable to repay the loan. This may be minimized if collateral is required. For example a bank loaning money may request a guarantee in the form of some valuable asset against the loan. Therefore is the company default on the loan the bank will still have a claim on an asset outside of the company’s control, potentially a director’s asset?  The debtors upside is limited to the interest payments and the loan repayment (4).

This said, we can now see why an investor will study the gearing of a company before investing.  Debt-to-equity ratio (total debt / total equity), and debt ratio (total debt / total assets times interest earned (EBIT / total interest), equity ratio (equity / assets),) are all examples of gearing ratios. One of the most useful examples is the debt/equity formula. Many analyses view a ratio exceeding 1 to be too high a gearing. A gear of 1 suggests a business financed 50% through equity and 50% through debt. High gearing, where debt exceeds equity, suggests high financial risk and has an adverse impact on a business’s credit profile. Lower gearing also has another positive affect on the outlook of an investor on the firm in terms of ability to expend. If a firm has low gearing it has scope to finance new projects or expansion through debt. This is always very useful if the firm does not seek to dilute the company anymore. This is attractive for all investors. CFOs study investor’s preferences and performance of the company in order to maintain the optimal level of debt-equity once reached (5).  The graph below shows some of the factors CFOs take into account when deciding on the issuance of debt.

 Image

(6)

            As you can see, the capital structure decision does not only affect the performance of the business but also the attractiveness of the business to potential investors. A balance of debt and equity is usually favourable in most business. The ratio of these is dependent on factors that I have outlined above such as its stage in its life cycle; the level of growth the firm is experiencing; the current leverage of the company.

References

(1)   Modigliani, Franco, and Merton H. Miller. Corporate income taxes and the cost of capital: A correction. American Economic Review 53:3 (June 1963): 433–443. Online at: www.jstor.org/stable/1809167

(2)   mac and Bhaird, C., & Lucey, B. (2010). Determinants of capital structure in Irish SEMs. Small Business Economics, 35(3), 357-275.

(3)   Modigliani, Franco, and Merton H. Miller. The cost of capital, corporation finance, and the theory of investment. American Economic Review 48:3 (June 1958): 261–297. Online at: www.jstor.org/stable/1809766

(4)   Equity vs Debt Research: the key difference is ‘Risk’, The Financial Express, Available online At: http://www.financialexpress.com/news/equity-vs-debt-research-the-key-difference-is-risk/142850/0

(5)   Graham, J.R., & Harvey, C. R. (2001). The Theory and practice of corporate finance: Evidence from the Field. Journal of Financial Economics, 60(2-3), 187-243

(6)   Graham, J.R., & Harvey, C. R. (2002). How Do CFOs Make Capital Budgeting and Capital Structure Decisions. Journal of Applied Corporate Finance, Vol 15, No. 1


Leftist View: Argument against Paying Dividends (Topic 7)

A dividend can be defined as ‘a taxable payment declared by a company’s board of directors and given to its shareholders out of the company’s current or retained earnings, usually quarterly. Dividends are usually given as cash (cash dividend), but they can also take the form of stock (stock dividend) or other property. Dividends provide an incentive to own stock in stable companies even if they are not experiencing much growth. Companies are not required to pay dividends. The companies that offer dividends are most often companies that have progressed beyond the growth phase, and no longer benefit sufficiently by reinvesting their profits, so they usually choose to pay them out to their shareholders, also called pay-out’(1). Whether or not a company decides to pay dividends is entirely their own choice and only a small percentage of companies actually do. The debate is on-going whether or not a dividend paying stock or a non-dividend paying stock is more valuable. I am going to discuss why I and many others believe that a non-dividend stock should be favourable to investors.

Why do some shareholders believe that a pay-out of €1 is preferable to a €1 capital gain when there are so many reasons stating the contrary? Statesman looks at this fact (2). He also explores an investor’s cognitive bias, mental accounting, in order to explain why an investor has trouble selling €2000 worth of stock while they would gladly accept a dividend pay-out to the same value. The view selling the stock as ‘dipping into capital’ when in essence that is what a company does to their/your capital when they issue dividends.

If a firm decides to not pay any dividend and instead reinvests the earnings back into the business the benefits to the shareholder should compound over time and the overall return should be higher. For a volume business such as Unilever or craft this might mean higher stock levels which equals higher profits. Reinvesting in R&D provides the potential for a huge payback, a new drug for a pharmaceutical company or finding the new facebook or twitter for a venture capital business. It is in truth a gamble on the future. It provides a chance not a guarantee. This is what stocks should be about, taking a risk. If you’re looking for a steady return on your investment bonds are the way to go (4). They are less risky and your ‘dividend’ is guaranteed. Technology companies such as Apple could use the retained cash for marketing. Increased marketing = increased sales = increase profits.

One very important point is that you should consider, do you be believe that the company that you have a share in can provide you with the highest return or do you believe that you yourself would do a better job. If you trust that the business will provide the maximum return, which you should if you are invested in them, then you should hope that they don’t pay out dividends and that instead they reinvest your/their money in a hope to fuel future stock price appreciation. If you instead think that you would provide a higher return, then you shouldn’t have any capital invested in the company in the first place.

Image

(5)

As you can see from the chart above there is statistical evidence that non-dividend paying stocks vastly outperform dividend paying stock when analysing the S&P 500. This backs up. Some investors get caught up in the search for the highest yielding stock instead of the most valuable or one with most growth potential. (5)

One major problem that a dividend paying firm will likely encounter is a stage where they can’t sustain the current level of dividend that they offer. They must the cut or even bring their pay-out to a halt. This sends out alarm bells to existing and potential shareholders which can be detrimental to the stock performance and company image. This is where the information content of dividends can alter the share price not the actual change in dividend policy. Modigliani and Miller (1961), and Millar and Rock (1985) discuss this fact in detail. They describe how a dividend cut sends a signal to the market that the management is not optimistic about future performance and earnings (6, 7). Feldstein and Green (1983) dispute this issue. They argue that issuing dividends highlights to the market that the company is optimistic about the future and that growth is expected (8). This is true up until the point that the company runs into difficulty and is forced to reduce dividends, which will have the opposite effect to the issuing in the first place. Furthermore a dividend reduction will, in almost every case, have a far more detrimental effect on the share price than a dividend increase of the same magnitude would. Dividend paying stocks are also by nature overpriced in the first place. Many investors jump straight for a stock with a dividend, which pushes up the price. If the business suffers there will be a big hit to the inflated share price. This potential collapse can be a great opportunity for hedge fund managers to make a killing on shorting the stock of high dividend pay-out stocks.

 Image

(9)

            My final, and arguably most significant, reason why non dividend stocks shout be more favourable is surrounded with the issue of tax. The simple fact is, Irish and many international laws, are such that tax rates make returns on capital gains far more attractive than returns in the form of dividends. Investors usually have unused capital gains allowances while on the other hand have usually used up all their personal allowances. For example, if a company issues a dividend and you pay 25% tax on that dividend and then reinvest that 75% back into the company you will be minus 25%. If makes much more sense for the company to reinvest the profits which implies no taxes are paid, share count will be lower which thus boosts stock prices.

Dividends are less tax-efficient than stock buy-backs.

I will leave you with a simple real life example – Warren Buffett immediately cancels dividends are acquiring a textile company. This left the company with more money to reinvest, more opportunity for growth. Now Berkshire Hathaway and its investors are multi-Millionaires. Warren Buffett and many others like him can grow your return faster than you. Allow them to do this and don’t expect or even desire dividends until the absolute growth potential of the company has been reached

Image

References

(1)   Dividend Definition. Available online at: http://www.investorwords.com/1509/dividend.html

(2)   Statesman, Sheffrin . (1984). Explaining Investor Preference For Cash Dividends

(3)   Statesman, new book

(4)   Azzopardi, F. (2004). Dividend Irrelevance and the Clientele Effect, Available online at: http://www.francoazzopardi.com/research/dividend-irrelevance-and-the-clientele-effect.pdf .

(5)   Lebovitz, D. (2010). Dividend Paying Stock: Virtue or Vice?, Kobren Insight Management.

(6)   Miller, M. Modigliani, F. (1961). Dividend Policy, growth, ant the Valuation of Shares, The Journal of Business: Vol XXXIV No. 4.

(7)   Miller, M., Rock, K.  (1985). Dividend Policy under Asymmetric Information, The Journal Of Finance: Vol XI N0.4.

(8)   Feldstein, M. Green, J. (1983). Why Do Companies Pay Dividends?, American Economic Review 73, no. 1:17-30

(9)   Healy, P. and Palepu, K. (1988). Earnings information conveyed by dividend initiations and omissions, Journal of Financial Economics, 21.